Learning objectives
- Collects and records data.
- Represents the data in tabular form or bar graph.
- Represents fractions through chapatti chart or pie chart.
- Draws conclusion and inferences from the data.
- Solves simple problems using charts/data/graphs and picture
Duration: 2 classes
Class 1
- Collects and records data.
- Represents the data in tabular form or bar graph.
- Represents fractions through chapatti chart or pie chart.
Activity:
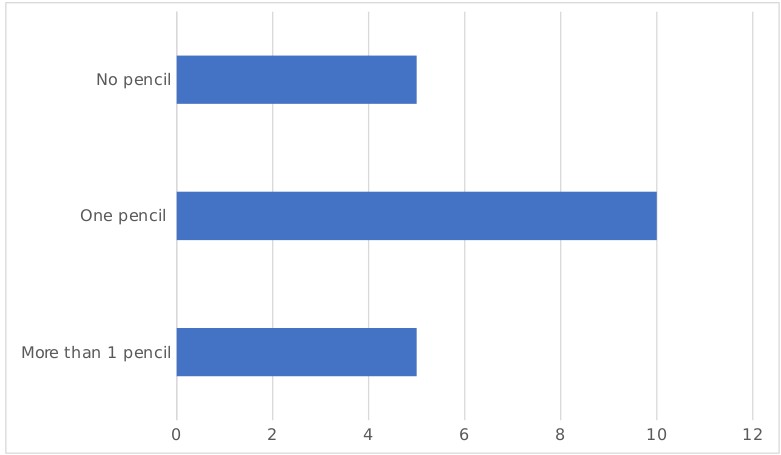
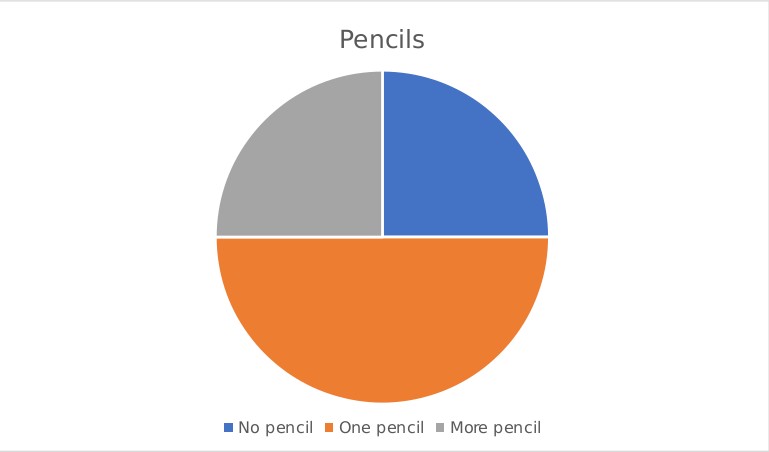
In this activity, the teacher should a question like “how many children have one pencil with them?”, “How many children have more than one?” and “How many do not have a pencil?”
With the answers given by the students, both bar charts and pie charts can be constructed using the blackboard.
Worksheet/Assessment
Worksheet for constructing bar chart and pie chart
Class 2
Draws conclusion and inferences from the data.
Solves simple problems using charts/data/graphs and picture
Activity
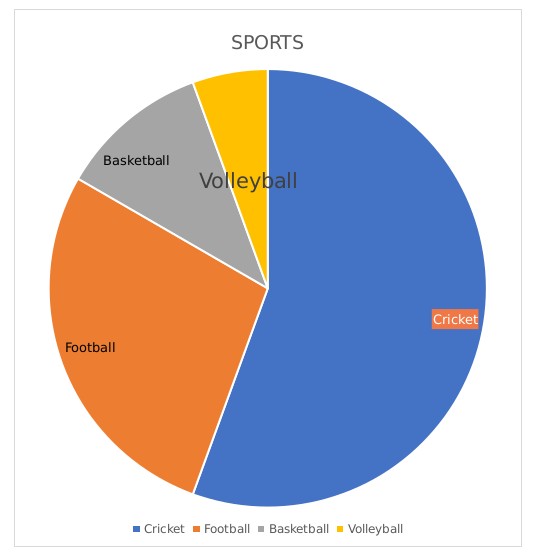
The teacher gives the scenario, by showing a pie chart in which the most liked sports are illustrated. The discussion should proceed with a series of statements to know whether the statement is either true or false.
Statements
- Football is the most liked sports.
- Volleyball is liked by more number of people than basketball
- Cricket is the most liked sports.
Worksheet/ Assessment
Worksheet for recounting the bar graph construction is given.
Term: Term 3
- Log in or register to post comments