Lesson objectives
- Gather and represent data using tally marks
- Represents the data pictorially and draws conclusion
Bridging – Learning objectives
- Collects, records (using pictures/ numerals) and interprets simple information by looking at visuals.
- Draws inference based on the data collected from people around
Teacher note – Data handling is an ability to collect, classify and interpret data. It is an important aspect of mathematical literacy. This skill is required to interpret any information from newspaper or textbook.
At primary level, children are exposed to various ways of presenting data and an understanding of how and why data must be collected and analysed. They are not expected to come up with their own presentations but are encouraged to understand how activities of quantitative information related to one another.
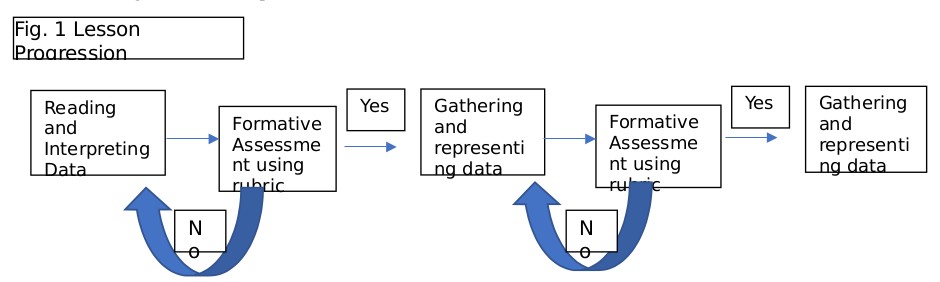
Four broad areas of data handling are
- Reading and interpreting data – Reading data and interpreting, beginning with answering questions based on the information in the representation and understanding what questions can and cannot be answered with the data provided.
- Gathering and representing data – Representing data in the form of tables, pictograms, histograms and pic charts (using suitable units)
- Drawing inferences – Child must draw conclusion from the data represented and verify it with hypothesis
- Formulating hypotheses and designing an experiment – More advanced skill, requiring child to make a hypothesis, understand the nature of data to be gathered and interpreted.
The activities in the module are designed to cater to the first three broad areas of data handling as mentioned above. As it is important for the lesson to be child centric for effective learning, the teacher can spend more time on activities where most of the students need help. The 4 broad areas will act as a milestone for the students learning, the teacher can assess the student’s level and then decide to move to next area of data handling. (Fig. 1)
The teacher can create their own activities based on the rational mentioned in the 4 broad areas of data handling for additional practice.
Activity for reading and interpreting data

The fruit seller has different fruits with him. Look at the basket and find out what fruits are there.
- What fruits can you see in the basket?
- How many apples are there?
- Which fruit you like?
Worksheet
| Fruits | Name | Number of fruits |
 |
||
 |
||
 |
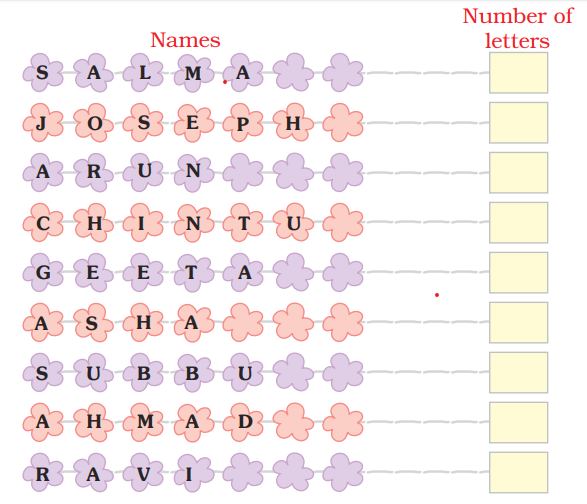
2. Activity for gathering data and interpreting simple information
Write your friend’s names?
- Students to write one name on their notebook
- Teacher to write a few names on the board
e.g.
Discussion to carried out in classroom with students. Sample questions given below,
- How many names have four letters?
- How many names have five letters?
- Whose name have more letters?
- How many names starts with the letter A?
- Which letter comes in the last the most?
3. Activity to gather and record data, interpret and draw conclusion
Water we drink
Ask your friends how many glasses of water you drink daily. Record the data pictorially.
Worksheet
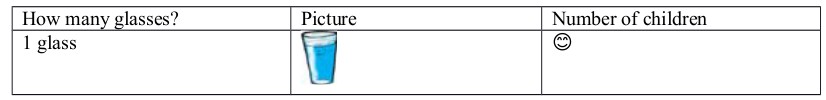
Who drinks most water? Questions
- Who drinks less water?
- Number of children who drinks 2 glasses of water?
- Number of children who drinks more than 3 glasses of water?
.jpg)
Term: Term 3
- Log in or register to post comments