Objective
- To collect objects and group them
- To recognize the pattern and draw inference
Dice game and Data collection
Instructions
- Throw a die.
- Look at the number of dots you get on the face of your die.
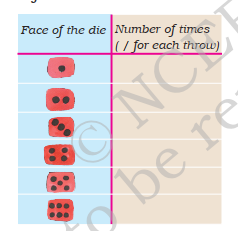
- For each throw draw a mark / in front of that number in
- the table.
- Throw the die 30 times and mark in the table each time.
For example, Rabia threw her die 30 times. She got five
times. In her table she will mark as given below.

Use the following table to fill the data.
This table can be drawn on the board, instead of printing as worksheet.
Data interpretation
Probing questions for teacher
- Which face of the die did you get the most number of times?
- How many times did
 come up? ________Times
 -
 came up more number of times than
 - Compare your table with that of the student sitting next to you. Do you find any difference in the two tables?
Worksheet 1
Grade:
4
Subject:
Primary Maths
Term: Term 3
- Log in or register to post comments